Introduction
SnowView is an interactive mapping tool that brings together snow, precipitation, satellite imagery, station observations, and forecast information to help users understand snowpack conditions and their importance for water supply. Its University of Arizona Snow Water Artificial Neural Network (UA SWANN) snow water equivalent (SWE) maps show how much water is stored in the snowpack, while historical comparisons help put current conditions into context.
SnowView is useful for water supply and reservoir managers, irrigation districts, watershed and land managers, researchers, educators, and anyone interested in how mountain snow contributes to water resources. SnowView provides a way to monitor snow and precipitation across watersheds, compare conditions with previous years, explore differences by elevation, and download data. Explore the map layers, watershed dashboards, interactive timeseries, and forecast products to assess seasonal water availability and communicate changing conditions.
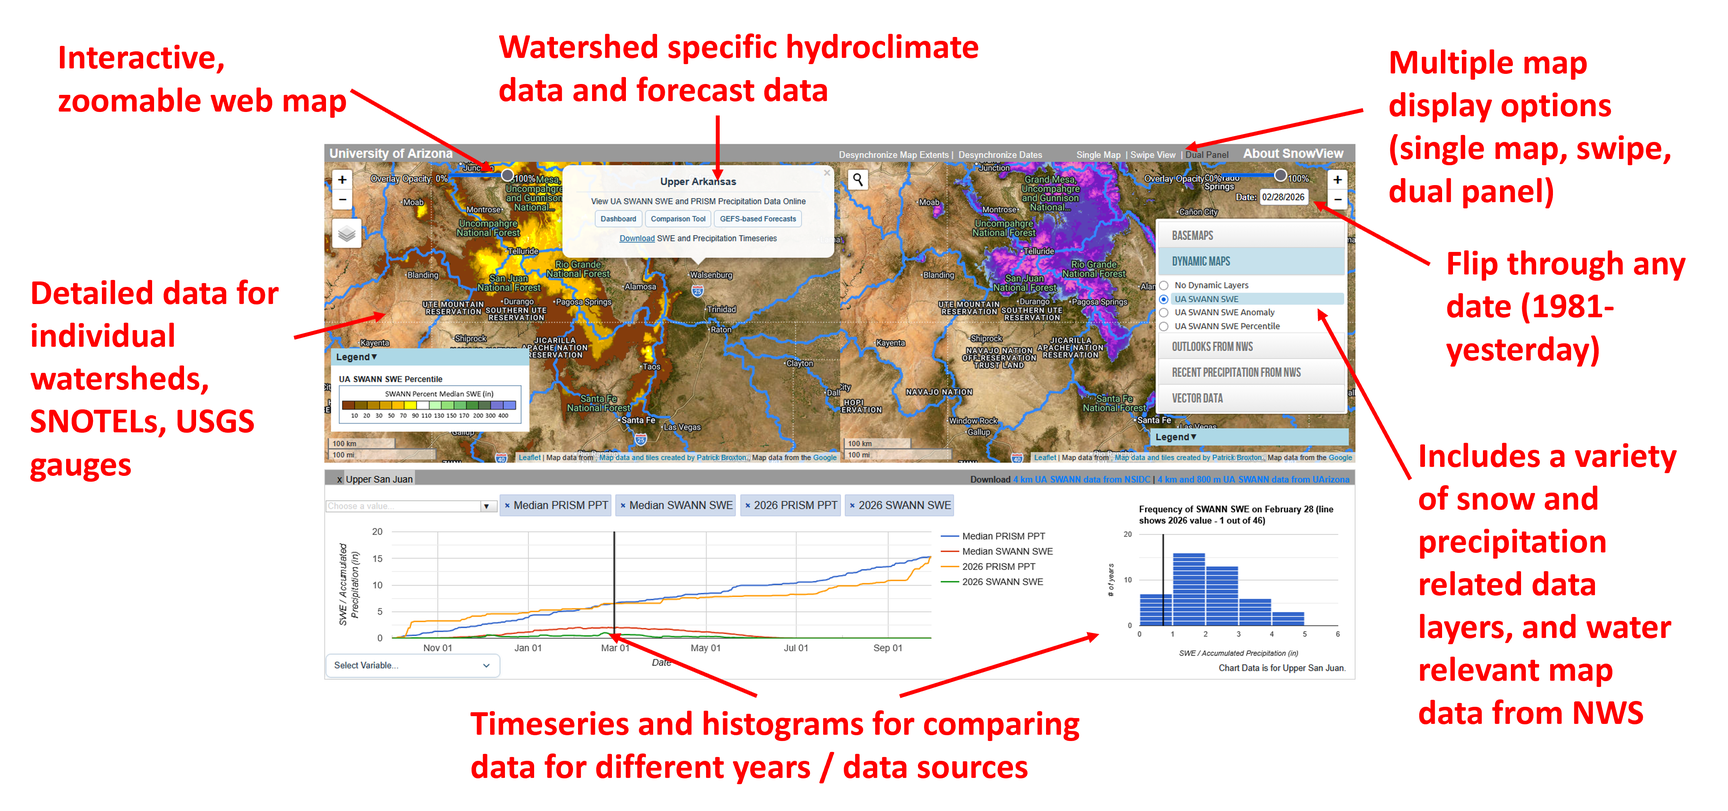
Mapping
Explore SWE, accumulated precipitation, snow cover, and satellite imagery to see how conditions vary across the landscape. Historical comparisons provide context for the selected date, while recent precipitation estimates and National Weather Service (NWS) outlooks show current observations and expected conditions. Add watershed boundaries and station locations for local context.
Use the layer picker and date controls to choose what to display. Single Map shows one map, Swipe View compares two maps with a movable divider, and Dual Panel shows two maps side by side. These comparison views let you explore different products or dates together. Adjust layer opacity to reveal the basemap underneath, and check the legend for units and valid periods. See Map Layers for descriptions of the available products.
Watershed Metrics
Click a watershed to explore its UA SWANN SWE and PRISM precipitation records. Dashboard provides a summary of current conditions, including differences by elevation. The Comparison Tool offers interactive timeseries and climatological histograms to explore current and past years. GEFS-based Forecasts provides graphics of experimental monthly projections.
These tools help connect conditions on the map with seasonal changes within a basin. See Watershed Metrics for more information about each option.
Downloads
Click Download in a watershed popup to save a CSV containing UA SWANN SWE and cumulative water year precipitation from PRISM for the entire watershed and its 500 ft elevation bands. Gridded UA SWANN SWE datasets are also available through the download links at the bottom of the page. See Download Data for details about both download options and their file formats.
On smaller screens
SnowView also works on mobile devices though some of the functionality is not available on smaller screens. Users on mobile devices can view the maps, watershed dashboards, and watershed graphics, but not the multimap displays, comparison tool, and data downloads.
Who Made SnowView Possible
The development and maintenance of SnowView and the UA SWANN dataset have been made possible through support from the Salt River Project (SRP), the National Aeronautics and Space Administration (NASA), the National Oceanic and Atmospheric Administration (NOAA), and the US Bureau of Reclamation.