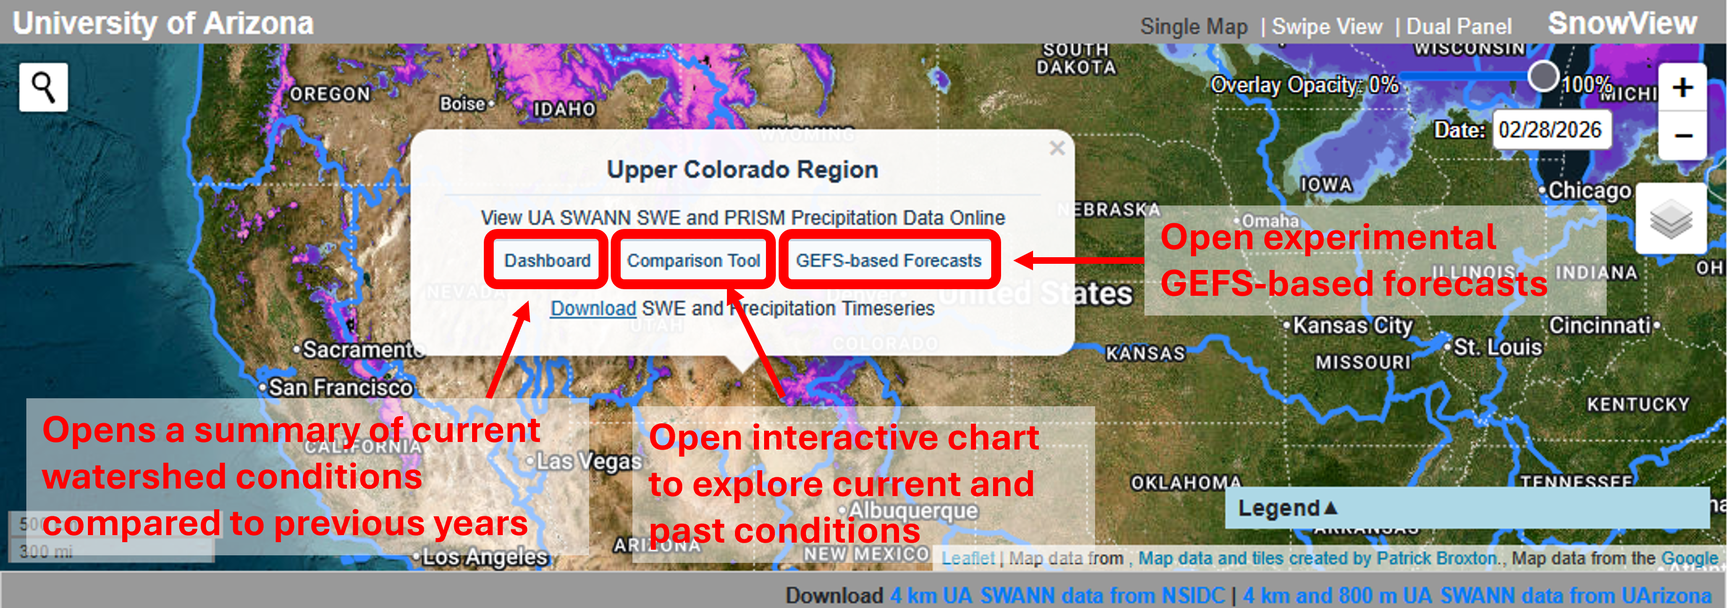
Watershed Metrics
Click a basin boundary to open its popup to have the option to open a summary of UA SWANN SWE and PRISM precipitation for the selected watershed (Dashboard), open an interactive tool to explore current and past UA SWANN SWE and PRISM precipitation (Comparison Tool), or open graphics showing experimental monthly projections driven by UA SWANN and the Global Ensemble Forecast System (GEFS) (GEFS-based Forecasts).
Note that Dashboard and GEFS-based Forecast graphics are current forecast graphics, rather than historical graphics selected with the date picker.
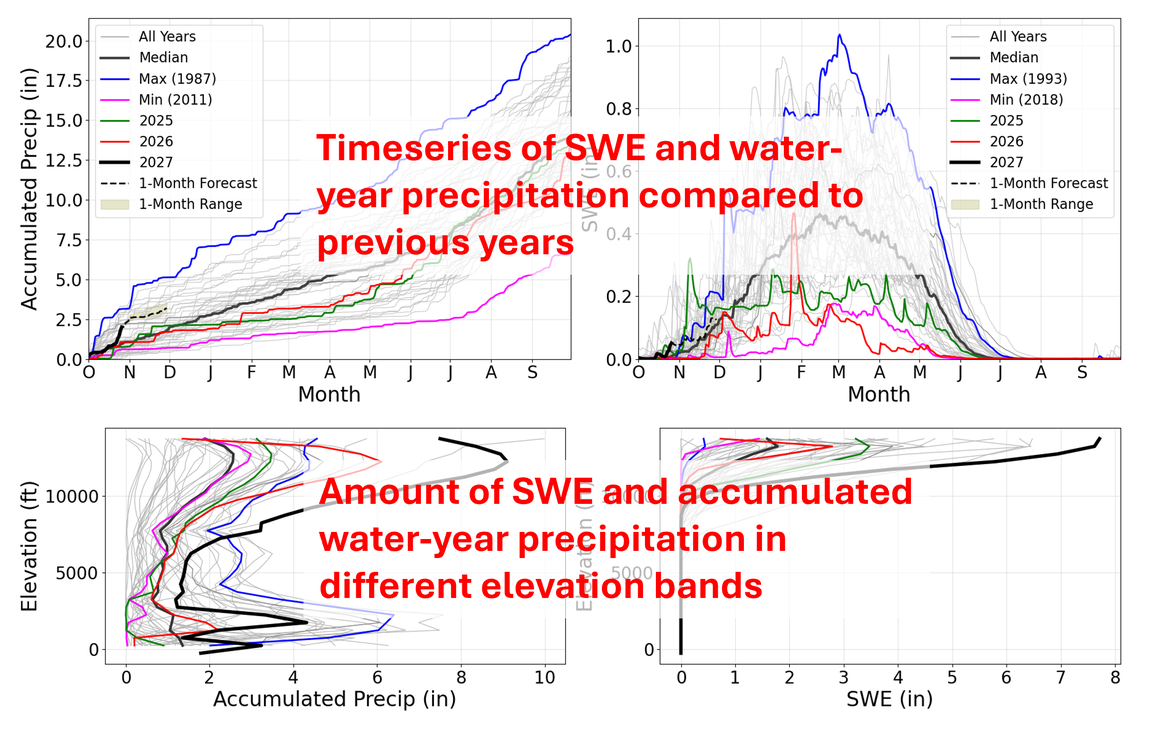
Dashboard
Click Dashboard in a watershed popup to view summary graphics of UA SWANN snow water equivalent (SWE) and PRISM precipitation for the selected basin. The dashboard includes timeseries and an elevation plot, bringing together conditions over time and across the watershed's elevation range. Use these graphics for a quick overview of the basin before exploring individual years or variables in the Comparison Tool. The graphics open over the map; click the chart overlay to return to SnowView.
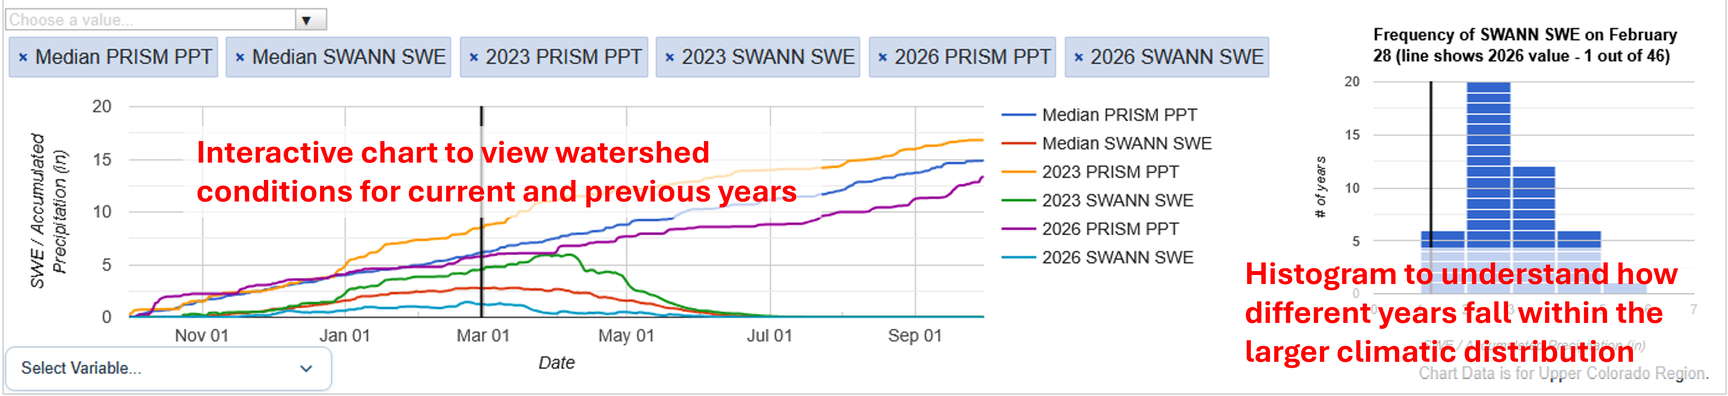
Comparison Tool
Click Comparison Tool to open the selected watershed's UA SWANN SWE and PRISM precipitation records in an interactive chart panel. Select a variable and the years you want to display to explore current and past conditions. The data are displayed in a timeseries chart as well as a climatological histogram, and clicking on different elements will update other elements and change the map display to align with the click. Add other watersheds to the tool to explore their records in separate tabs. Use this view to examine seasonal changes and compare years in more detail than the dashboard summary.
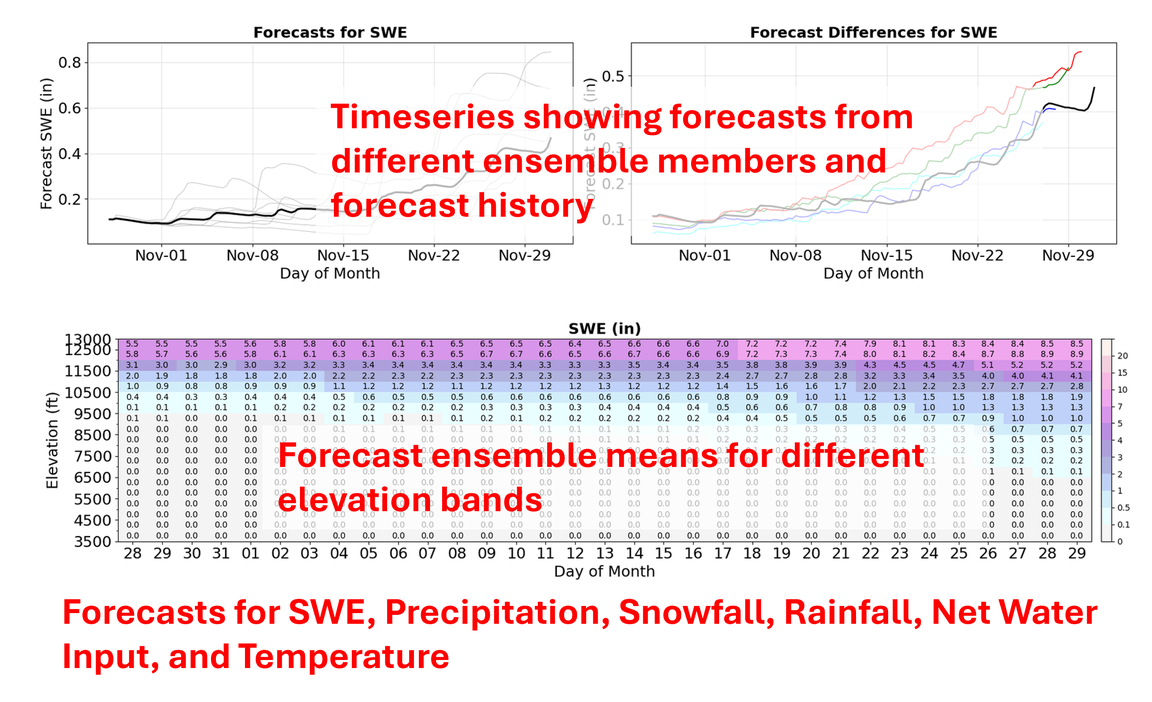
GEFS-based Forecasts
Click GEFS-based Forecasts to view experimental monthly projection graphics for the selected watershed, driven by UA SWANN and GEFS. The graphics show projected snow and other hydroclimate conditions, with additional elevation plots for the one-month forecast. Use these views to explore how conditions may change over the coming month and how those changes vary with elevation. Click the chart overlay to return to the map.